
Scanner
Compare supplied symbols using price, volume and liquidity. Rank them for research, not as trade picks.
Find the symbol. Question the idea. Keep the evidence.
Bring market charts, a six-role Research Assistant, connected evidence and your trading journal into one place. Explore the working tools and a prepared research example before making it your own.
Free demo · no account or card needed · live AI not activated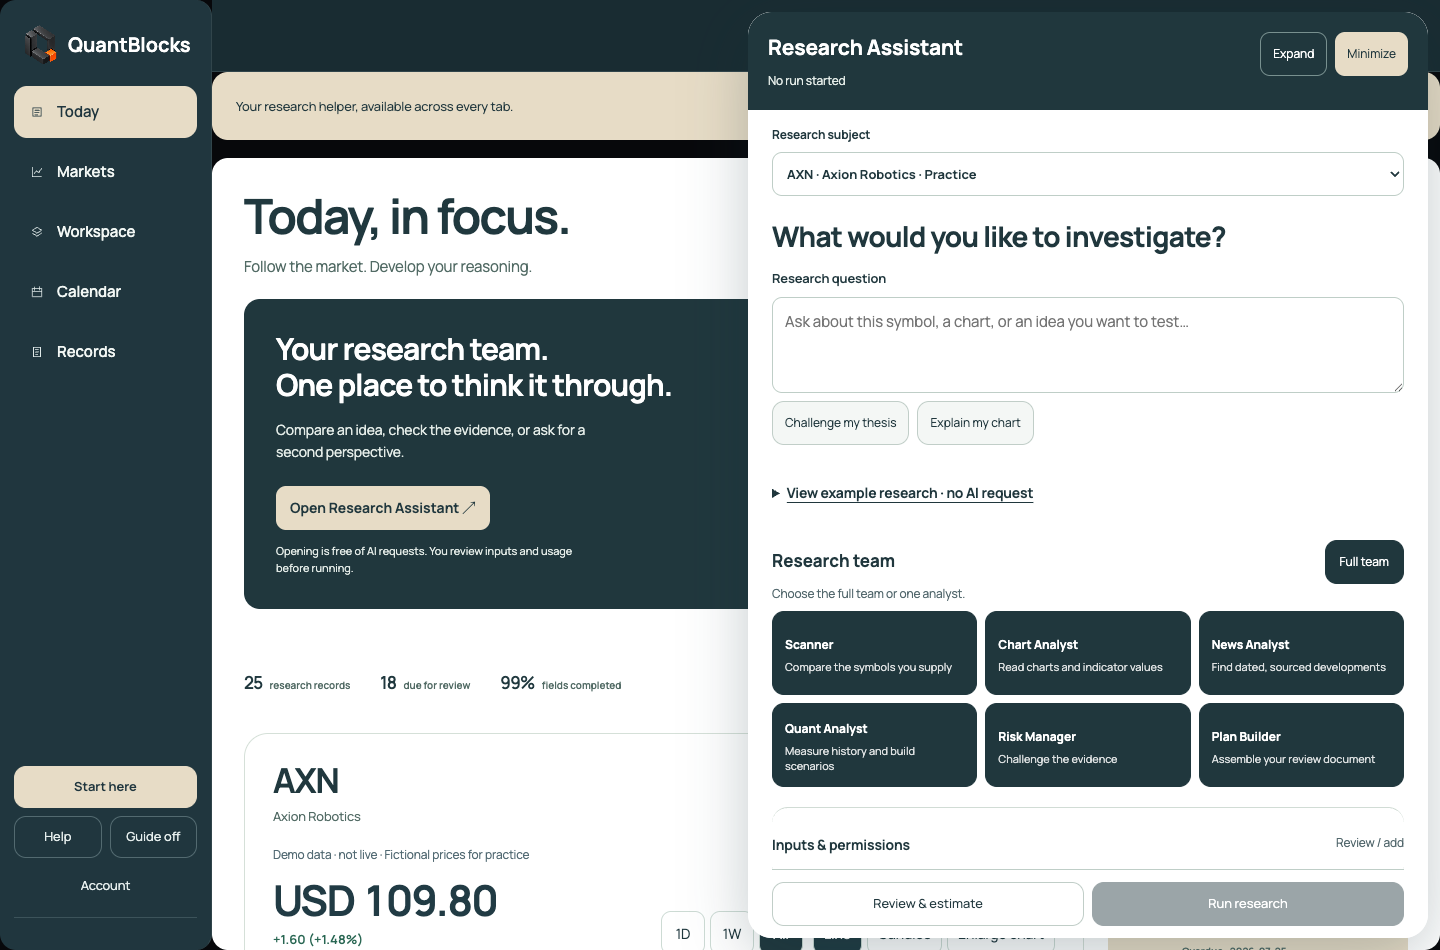
For independent investors and traders who want to understand their decisions.
Research thoughtfully. Keep the evidence. Learn from the record.
Research Assistant is available at the top of every product tab. Ask a question, choose the full team or one analyst, and inspect the reasoning.
Compare supplied symbols using price, volume and liquidity. Rank them for research, not as trade picks.
Explain a supplied chart: trend, key levels, conflicting signals and what would invalidate the read.
Organize dated developments and sources. Flag what could change the research idea.
Measure supplied history and describe scenarios. Say when there is not enough data.
Challenge the idea, identify missing evidence and decide whether more research is needed.
Bring the findings into a document marked READY FOR HUMAN REVIEW. No orders are placed.
Explore a hand-written AXN example in the actual report layout. Sources, missing evidence, risk and the final plan are visible. Live AI runs are not yet activated.
Move from a symbol to its chart, from a claim to its source, and from a trade to your reflection. Keep the context with you.
Browse 10 featured symbols in each of five categories: Stocks, Crypto, Forex, Commodities and Robotics. Inspect price history, then open the light or full Evidence File.
Use Demo prices, or connect your Twelve Data account. Data availability and request limits depend on your provider plan. TradingView supplies the chart technology.
Explore Markets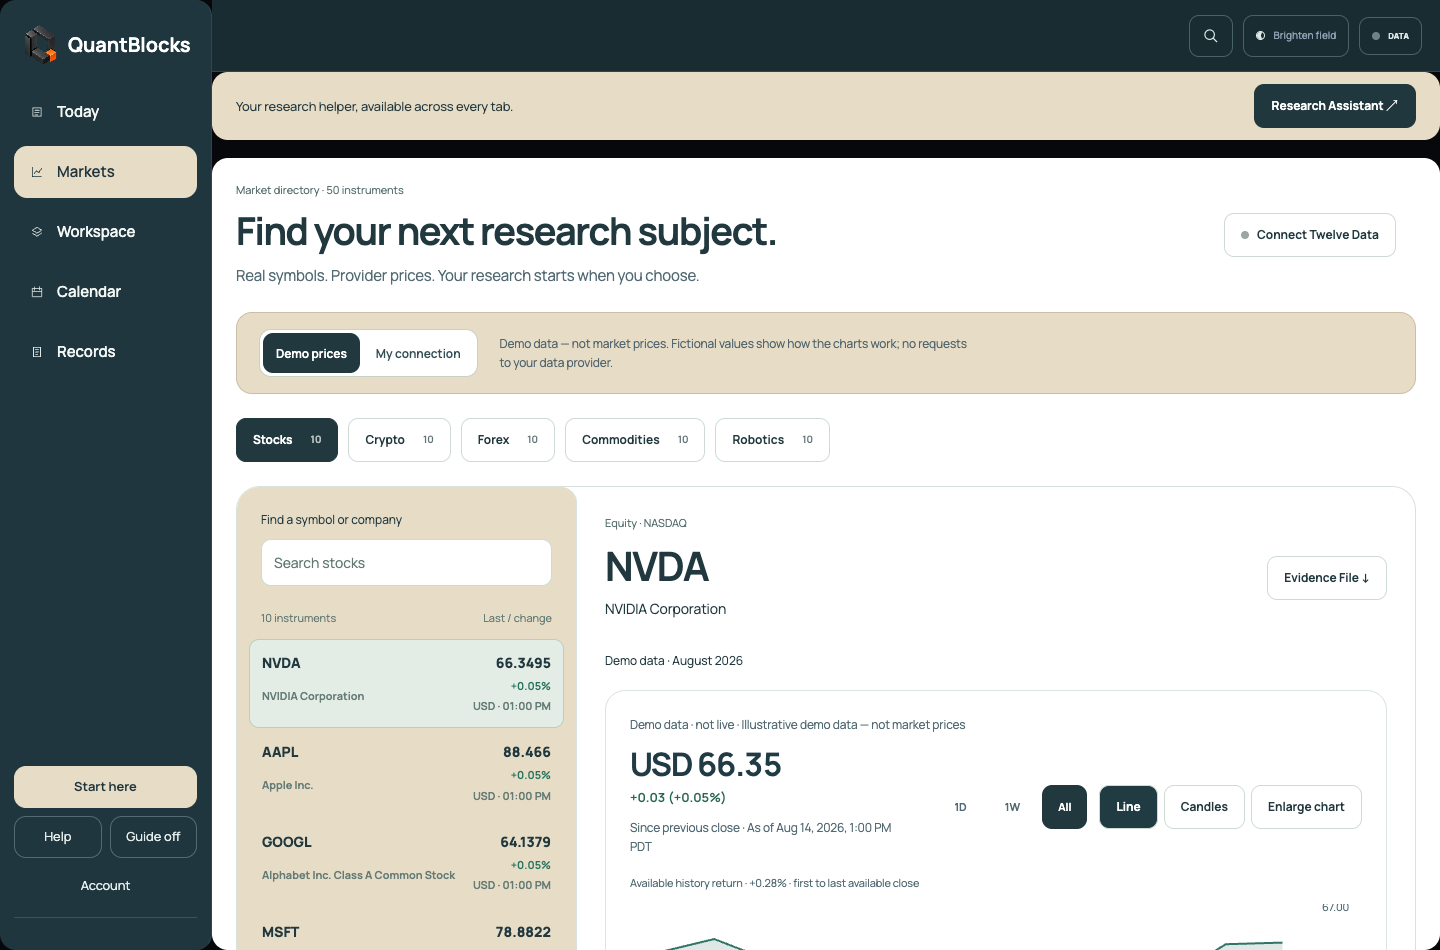
Use Market Rings to explore a company, its saved connections and the conditions it operates in. Follow a saved connection and inspect the evidence behind it.
Connections show what has been recorded. Two companies appearing near each other on the Research Map does not mean one causes changes in the other.
Explore the Research Map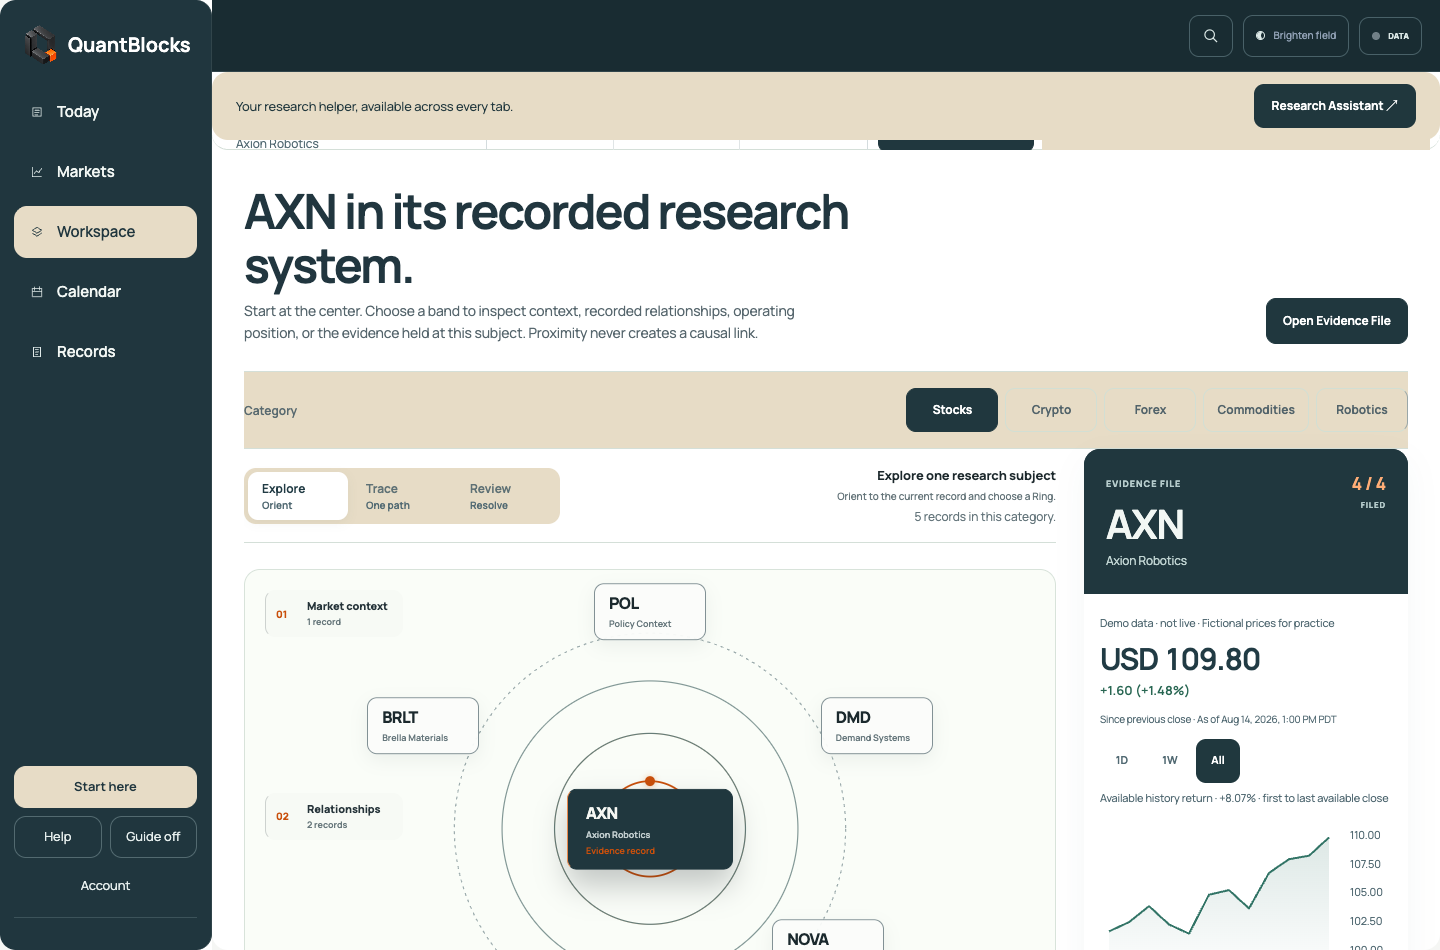
Keep your main research idea, what could drive change, main risk and next check in one Evidence File. Compare price context with a network of supporting and challenging evidence, inspect sources and retain dated changes.
Your sources and conclusions remain yours. QuantBlocks does not turn them into buy or sell recommendations.
Inspect evidence in the demo
Import completed trades, open a date and inspect the recorded prices alongside notes, reflection and screenshots. Review monthly totals and keep research checks in the same calendar.
The demo includes practice trades. Imported trades stay separate. Profit or loss is estimated after fees, matching sells to the earliest buys first (FIFO), when purchase records are available. Currencies stay separate.
Explore the journal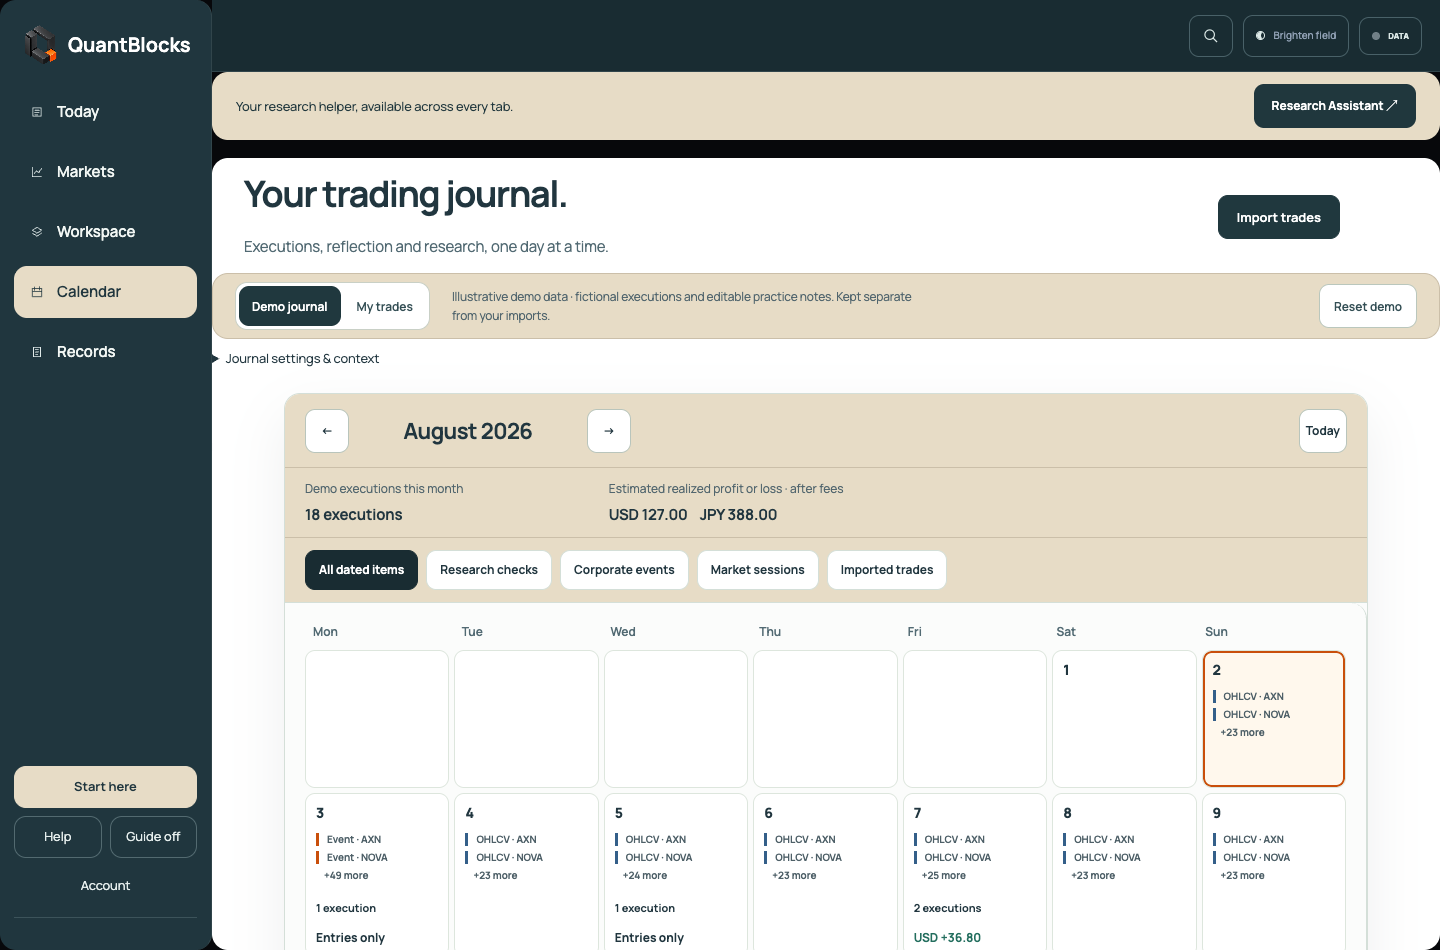
QuantBlocks helps you organize the work around a decision. The charts, research and journal each have a role.
Start in Markets or Today. Choose a symbol and inspect its price context. In the practice walkthrough, follow fictional AXN and its demand-growth question.
Ask the Research Assistant a question. In the prepared example, inspect six perspectives, trace the source register and understand why the idea needs more research.
After a configured AI run, save the report to the Evidence File. Keep your next check and review history with the idea, then use Calendar to reflect on completed trades.
Walkthroughs move to the control you need, highlight it and explain what to do. Or explore freely and open Help when you need it.
Practice with demo data. Build your own records in My Data.
Research, journal notes and imported trades are stored in this browser. Demo records stay separate from your own data. Export available backups and journal data to keep copies outside the browser.
Connecting Twelve Data requests market data from your provider. QuantBlocks does not execute trades or connect to a brokerage to place orders.
Read the data boundaryExplore the working product before considering a membership. Paid checkout is not open yet.
Free
Explore Markets, Research Assistant examples, Market Rings, Evidence Files and the trading journal with practice data and contextual guidance.
Open the guided demo No account or payment required.$9 / monthor $79 / year
Planned local membership for adding your own research in My Data, writing evidence notes, exporting files and restoring backups.
Once customer access is activated, you will sign in, complete secure Stripe checkout, and return here for payment verification.
After verification, a welcome screen will open your browser workspace. No download is required for that path. Checkout remains closed while this setup is tested.
Independent investors and traders who want to organize market context, research evidence and trading reflections in one place. You make the decisions; QuantBlocks helps you keep the reasoning and record.
Demo prices and practice trades are practice data. Choose My connection and connect Twelve Data for provider prices and history, subject to your plan. Each chart shows its data status. TradingView is the chart technology, not the market-data API.
The interface and prepared example are available. Live AI analysis is not activated on this public site yet. The example is hand-written, uses a fictional company and makes no provider requests. Opening the assistant does not use AI credits.
No. You can import completed trades into the journal and reflect on them. QuantBlocks does not place orders or hold funds.
Your research and imported trades are stored locally in this browser. Clearing browser storage can remove them. Use the available export and backup controls to retain copies; the public demo does not provide cloud synchronization.
Not yet. The displayed Local membership pricing is planned. Paid checkout and customer delivery are not active. Ask about Local for availability.
Open the guided demo, use Start here for a walkthrough, or open Help. Guide mode highlights the relevant control and explains the next step. You can turn it off and explore freely.